This page goes with the March 2022 ICTCM Conference program announcement and is an advertisement for the live interactive workshop, Everyday, Everywhere Mathematics at noon on Monday, March 14. It also suggests some items you might want to gather from around your house to get the most out of the workshop. These items aren’t necessary but would add a lot.
The first item is a pair of red-cyan 3D eyeglasses. These glasses come with children’s and other 3D books. If you want to use them in classes they can be purchased from Amazon and other sources for less than $10.00 for a package of 50.
The second item is paper clips. We recommend two sizes – small and jumbo. My favorites are four inch jumbo paper clips that can be purchased from Amazon and other sources in a package of 40 for under $10.00. If you want to use them in class each student or team should have three. I also use the standard size paper clips that can be purchased in a package of 10 boxes of 100 each for under $7.00. This is enough for several classes.
We begin with a variation on Daniel Kahneman’s title, Thinking, Fast and Slow. We use the word “seeing” with two meanings – seeing with our eyes and understanding. The sentence “I see” has the same double meaning. We link the first meaning with our eyes but, in fact, our brains are important organs of sight. Look at the three pictures below using the red-cyan 3D glasses. Each of your eyes sees a different image through the glasses and your brain reconstructs a 3D model of the scene.


The two figures below are taken from Daniel Kahneman’s book, Thinking, Fast and Slow. If you measure the two horizontal Iines on the screen in the first figure you will see they are exactly the same length. If you measure the heights of the three men on the screen in the second figure you will see they are exactly the same but in both cases your immediate reaction is that the length of the lines is different and the heights of the men are different. Your brain’s “fast” processing interprets the scene and changes your immediate perception.
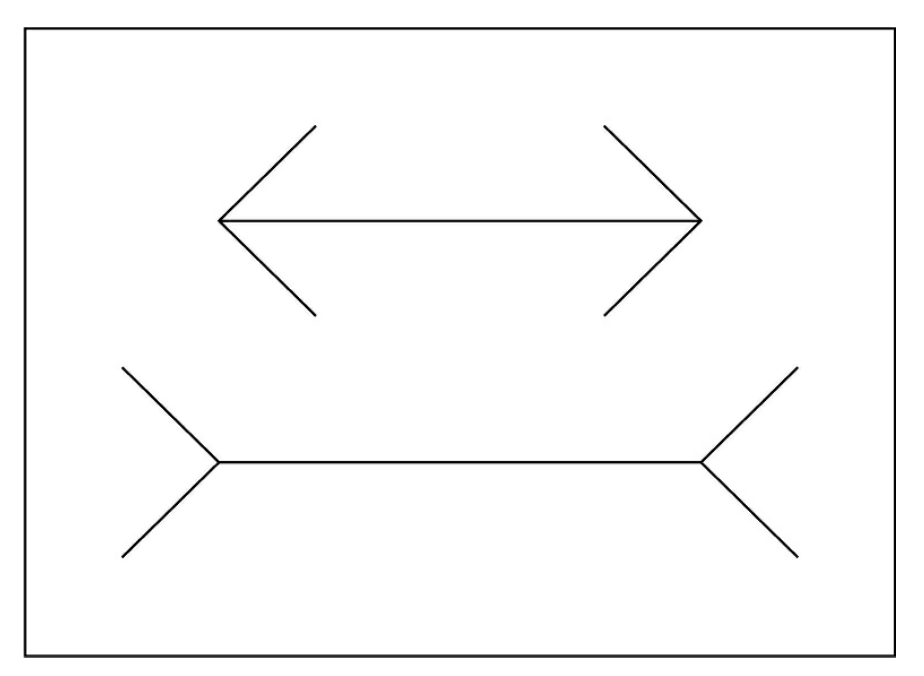

As mathematicians and scientists and as mathematics and science educators who seek to understand and improve our world by building mental models (theories) of what we observe we must understand how our perception is affected by the fast part of our brains as we look at the world around us. In addition to Daniel Kahneman’s book, Thinking, Fast and Slow, we recommend the work of Dan Kahan and others on the Cultural Cognition Project, which studies how culture affects perception.
The essence of understanding, what mathematicians call “modeling” and scientists call the “scientific method,” is a couples dance between experimentation and observation in the real world on one hand and our mental models or theories on the other. To really understand the life of a scientist, especially a scientist working to inform high stakes personal and public policy decisions, we must observe the world around us and we must do experiments in the world around us. Your home and your students’ homes are filled with everyday objects that can be used for everyday everywhere experimentation. For example, you can use washbasins, make-up mirrors and water glasses to experiment with optics. In the Everyday, Everywhere Mathematics and Science workshop we will do three examples of everyday, everywhere mathematics. The first workshop example uses the usual size and jumbo paper clips described above. Here is a sneak peek at that example.
Paper Clips and How to Tell When Your Country is Past the Point of No Return
At the precise moment when we need to work together to surmount problems like pandemics and climate change, our body politic has been shattered by extreme polarization. In the December 2022 Thomas Edsall wrote an essay How to Tell When Your Country is Past the Point of No Return based on a series of pieces in the Proceedings of the National Academy of Sciences including Polarization and Tipping Points that begins:
Our study was motivated by a highly disturbing puzzle. Confronted with a deadly global pandemic that threatened not only massive loss of life but also the collapse of our medical system and economy, why were we unable to put partisan divisions aside and unite in a common cause, similar to the national mobilization in the Great Depression and the Second World War? We used a computational model to search for an answer in the phase transitions of political polarization. The model reveals asymmetric hysteresis trajectories with tipping points that are hard to predict and that make polarization extremely difficult to reverse once the level exceeds a critical value.
In this experiment we use paper clips to help understand concepts like “hysteresis” and “tipping points” that can help us understand and, perhaps, overcome the dangers posed by extreme polarization. There are two pdf files below. The first is for students (you should use this first as a workshop participant) and the second is for instructors (for use after the workshop).
